The COVID-19 global pandemic has created a time of uncertainty and unparalleled measures around the world. Investors are hyper-focused on their portfolios and are feeling the pain of unprecedented dislocation in the markets.
Clearwater Analytics is the leading global provider of automated investment data aggregation, reconciliation, accounting, and reporting for insurers, investment managers, institutions, and corporations. Each day, Clearwater reports on more than $3.5 trillion in assets for clients in 49 countries. This daily reporting provides Clearwater with a unique perspective into how portfolios and the investors that run them are positioning.
The impact we have seen across our platform can be summarized by:
1. A sharp increase in trade volume
2. Average portfolio valuation decrease of -6%
3. A strategy of reinvesting in short duration assets until the uncertainty has passed
Decrease in Asset Valuations, Sharp Increase in Trade Volume
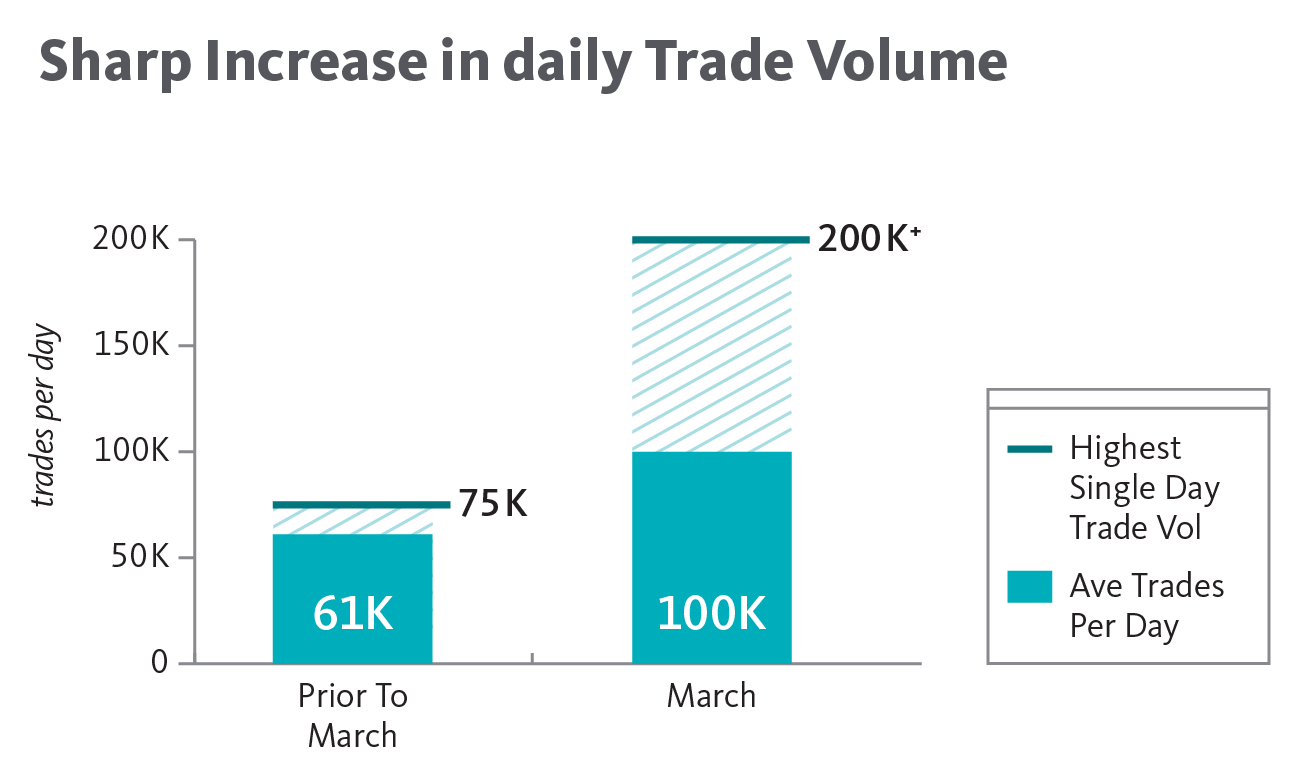
Clearwater reported on $3.86 trillion in assets as of year-end 2019. As of March 20, those total assets stood at $3.41 trillion. Across the Clearwater platform that decrease in assets has been accompanied by a drastic increase in trade volumes.
Prior to March, the average volume was 61,000 trades per day. In March, the 30-day average climbed to over 100,000 trades per day, and one day topped 200,000 trades.
Breaking Down Asset Class Exposure
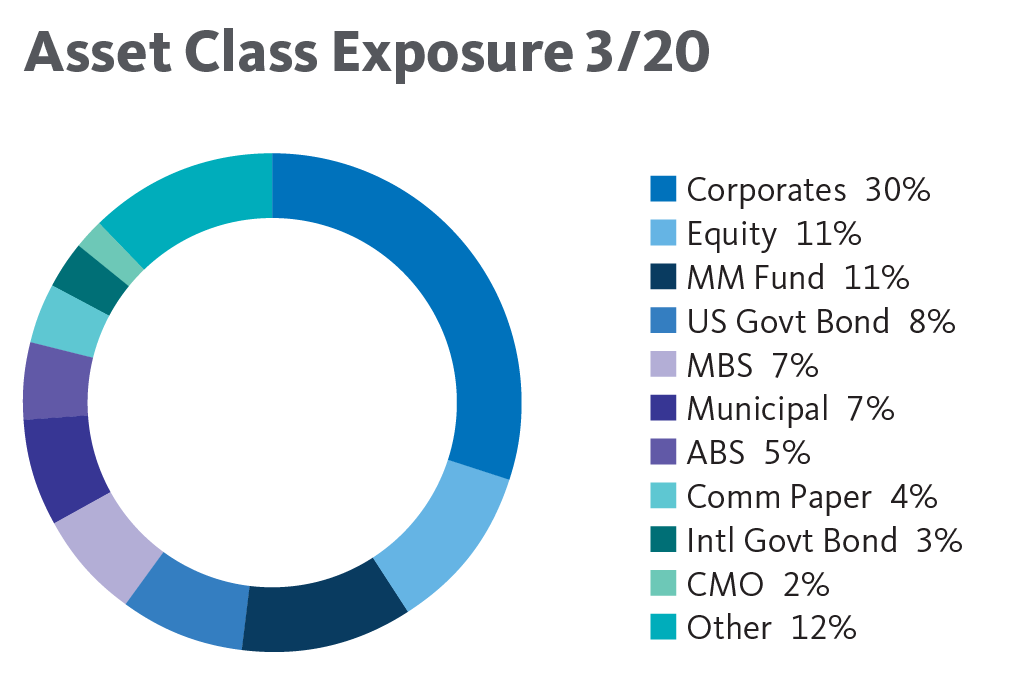
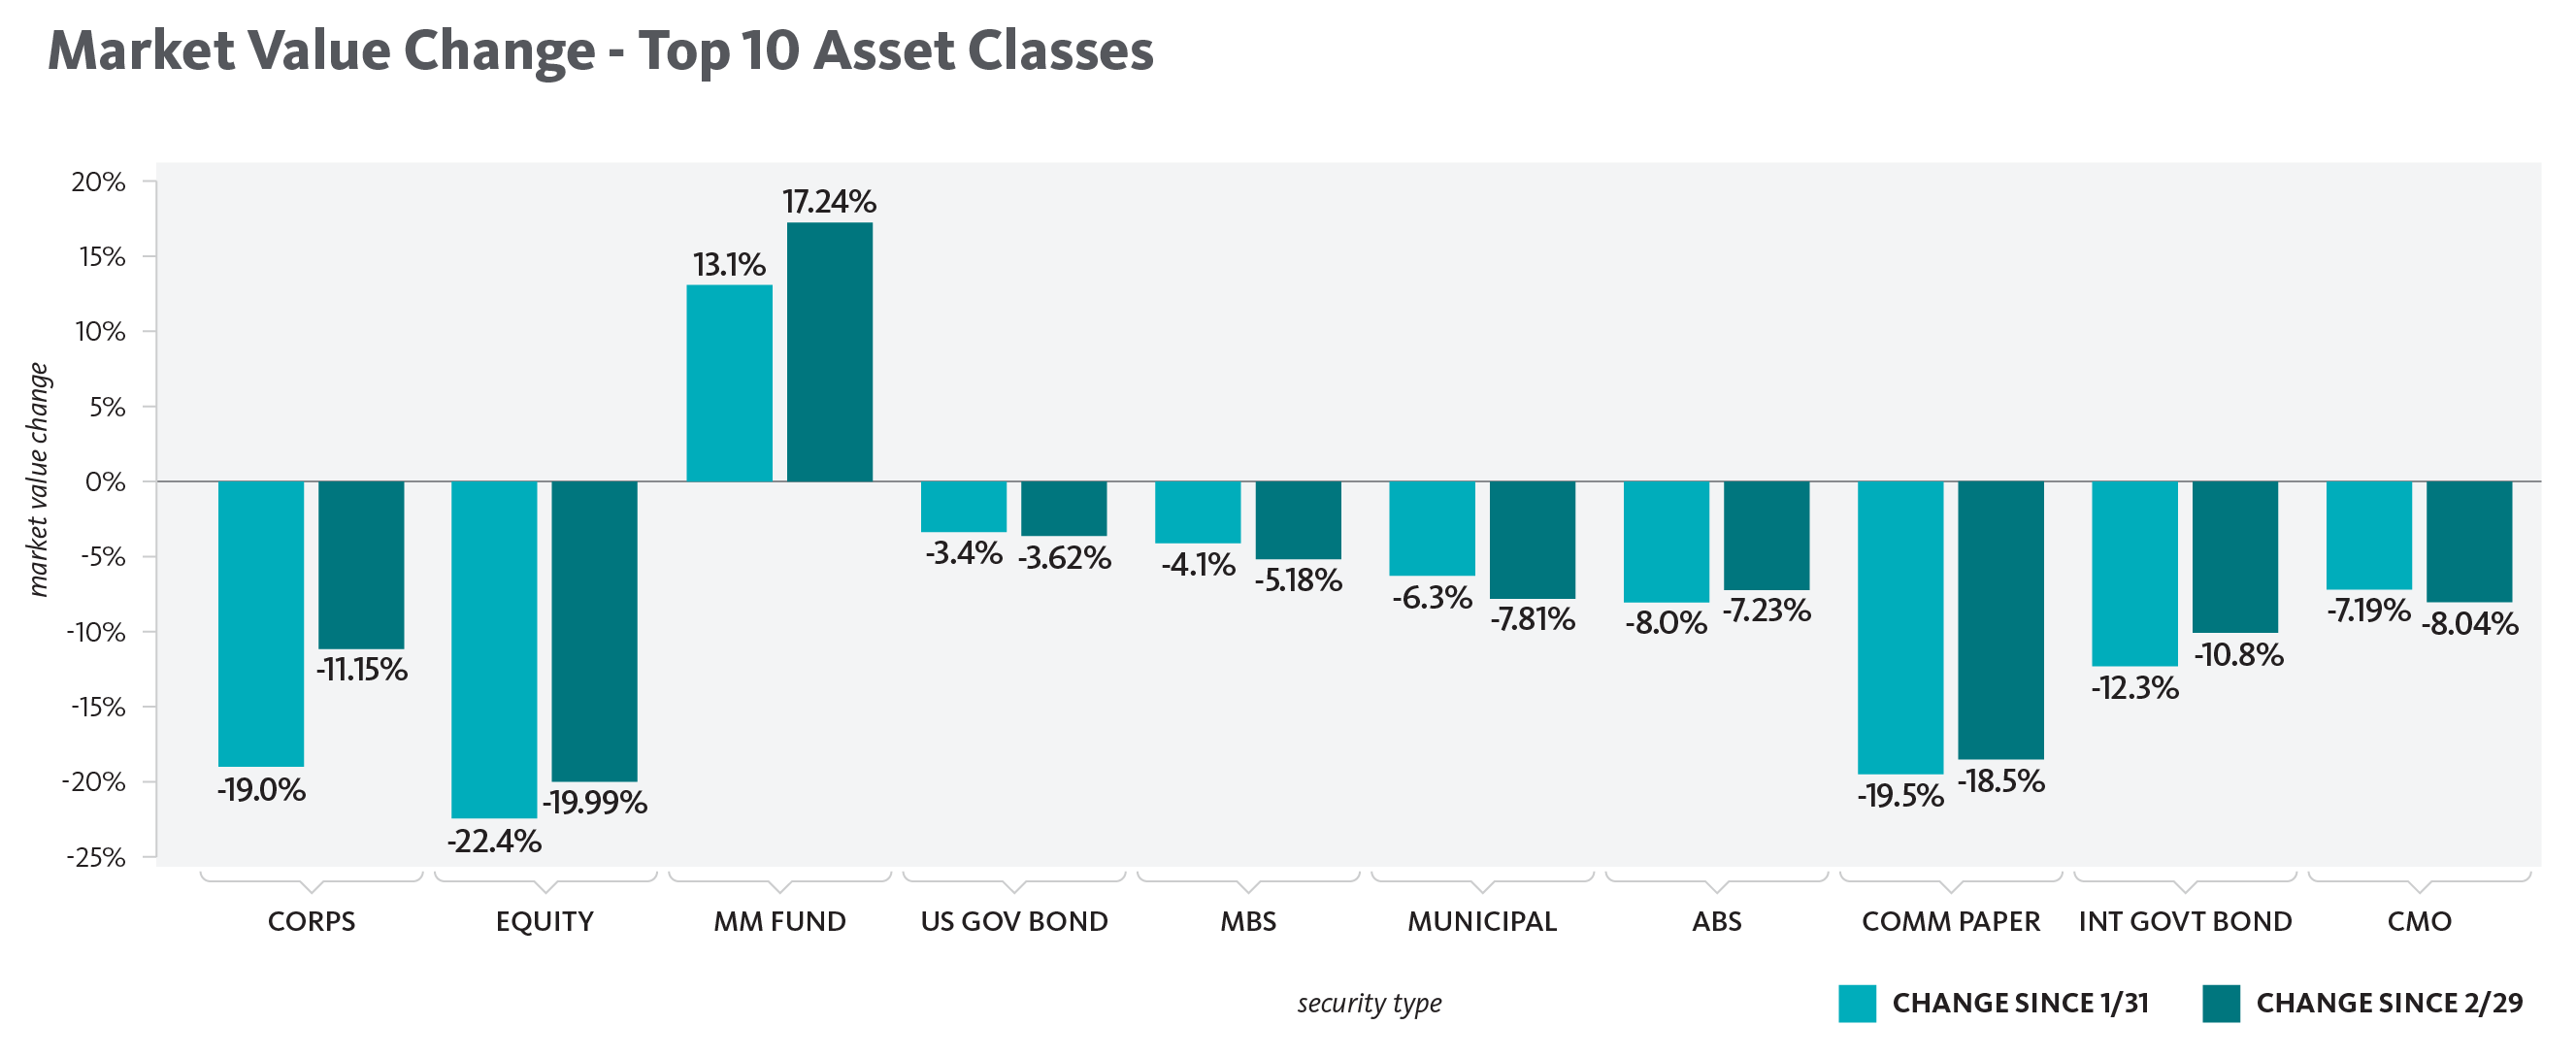
As we analyzed the breakdown by asset class, we found a rotation from assets like corporate bonds, commercial paper, and equities into short-term assets such as money market funds, US government bonds, and repurchase agreements, which is typical of the flight to quality, shorter duration positioning investors move toward in times of prolonged volatility. In parallel, as assets are maturing or paying down, we are seeing those cash flows largely reinvested back into those same short-term assets. These two factors combined have led to a 17% increase in money market fund values since the beginning of March alone.
The move out of corporates is something we will continue to monitor. Unlike 2008, many corporates will be adversely impacted not by actions of bad actors, but instead the very market segments they operate in (airlines, hospitality, entertainment).
Impact on Portfolio Performance
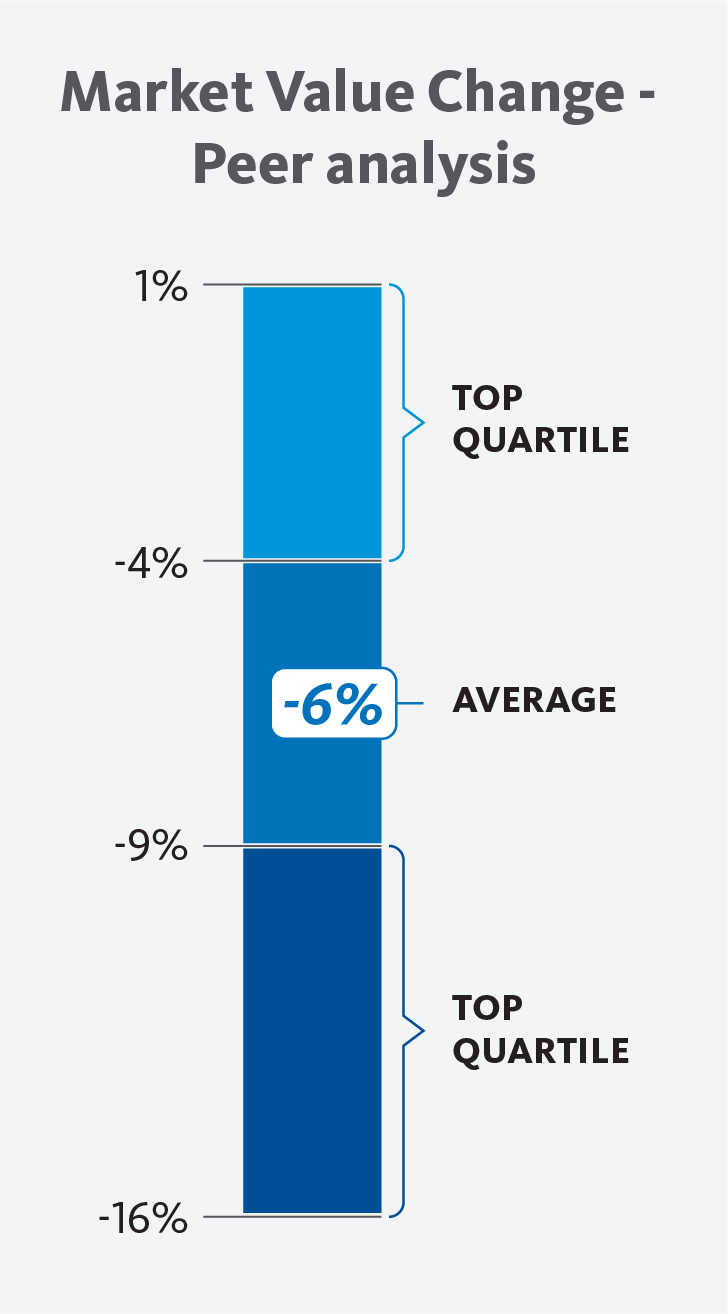
We explored how client portfolios are weathering the market volatility. Looking at a sample of client portfolios across all industries, we found mixed results. The chart to the right shows a peer analysis on portfolio performance since January 31, when the travel ban between China and the US was first instituted.
The average company in the sample has seen their portfolio valuation decrease by an average of -6%. The top quartile saw a change in their portfolio value between 1% and -4%. From an asset allocation perspective, these portfolios had an overall defensive posture to begin with, and were found to be overweight money market funds, derivatives, and/or municipal securities. Those in the bottom quartile have seen their investment portfolios drop between -9% and -16%, with most of the companies in this range having particularly high exposure to the riskier, more consumer-driven equity positions and the broad equity markets, as well as the oil and gas sector.
Looking Ahead
As the situation continues to evolve and factors like economic stimulus packages, when employees can return to work, resulting labor figures, and more come into play, investors will be tuned in to determine how this will impact their strategies with a close examination of performance returns and portfolio exposure.
We are monitoring the trends and will continue to lend insight into how investors are reacting both in the short and long-term during these uncertain times.
Disclaimer: Trade volume is based on total Clearwater system data as 3/20/20. Asset class data is based on top 10 asset classes by AUM across Clearwater’s entire system as of 3/20/20. The percentage represents the difference in AUM between 3/20 & 2/29 and 3/20 & 1/31/20. Portfolio value is based on a sample of 50 Clearwater clients across all industries (insurance, corporations, asset managers).